微信小程序图表插件(wx-charts)基于canvas绘制,体积小巧,支持图表类型饼图、线图、柱状图 、区域图等图表图形绘制,目前wx-charts是微信小程序图表插件中比较强大好使的一个
支持图标类型
- 饼图 pie
- 圆环图 ring
- 线图 line
- 柱状图 column
- 区域图 area
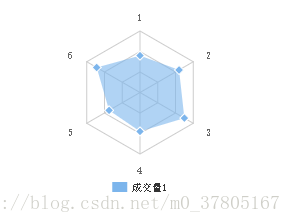
- 雷达图 radar
如何使用?
- 直接引用编译好的文件 dist/charts.js(js下载地址)
.wxml中定义
canvas canvas-id="lineCanvas" disable-scroll="true" class="canvas"/canvascanvas-id与new wxCharts({canvasId:”})中canvasId一致
2. 命令行
git clone github.com/xiaolin3303/wx-charts.gitnpm install rollup -gnpm installrollup -c 或者 rollup --config rollup.config.prod.js参数说明
opts Objectopts.canvasId String required 微信小程序canvas-idopts.width Number required canvas宽度,单位为pxopts.height Number required canvas高度,单位为pxopts.title Object (only for ring chart)opts.title.name String 标题内容opts.title.fontSize Number 标题字体大小(可选,单位为px)opts.title.color String 标题颜色(可选)opts.subtitle Object (only for ring chart)opts.subtitle.name String 副标题内容opts.subtitle.fontSize Number 副标题字体大小(可选,单位为px)opts.subtitle.color String 副标题颜色(可选)opts.animation Boolean default true 是否动画展示opts.legend Boolen default true 是否显示图表下方各类别的标识opts.type String required 图表类型,可选值为pie, line, column, area……opts.categories Array required (饼图、圆环图不需要) 数据类别分类opts.dataLabel Boolean default true 是否在图表中显示数据内容值opts.dataPointShape Boolean default true 是否在图表中显示数据点图形标识opts.xAxis Object X轴配置opts.xAxis.disableGrid Boolean default false 不绘制X轴网格opts.yAxis Object Y轴配置opts.yAxis.format Function 自定义Y轴文案显示opts.yAxis.min Number Y轴起始值opts.yAxis.max Number Y轴终止值opts.yAxis.title String Y轴titleopts.yAxis.disabled Boolean default false 不绘制Y轴opts.series Array required 数据列表数据列表每项结构定义
dataItem ObjectdataItem.data Array required (饼图、圆环图为Number) 数据dataItem.color String 例如#7cb5ec 不传入则使用系统默认配色方案dataItem.name String 数据名称dateItem.format Function 自定义显示数据内容详见demo(具体demo git地址)
1.pie
new wxCharts({ animation: true, //是否有动画 canvasId: 'pieCanvas', type: 'pie', series: [{ name: '成交量1', data: 15, }, { name: '成交量2', data: 35, }, { name: '成交量3', data: 78, }], width: windowWidth, height: 300, dataLabel: true, });}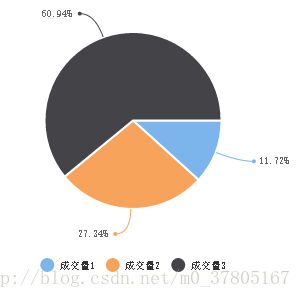
2. ring
new wxCharts({ animation: true, canvasId: 'ringCanvas', type: 'ring', extra: { ringWidth: 25, pie: { offsetAngle: -45 } }, title: { name: '70%', color: '#7cb5ec', fontSize: 25 }, subtitle: { name: '收益率', color: '#666666', fontSize: 15 }, series: [{ name: '成交量1', data: 15, stroke: false }, { name: '成交量2', data: 35, stroke: false }, { name: '成交量3', data: 78, stroke: false }, { name: '成交量4', data: 63, stroke: false }], disablePieStroke: true, width: windowWidth, height: 200, dataLabel: false, legend: false, padding: 0});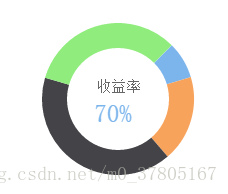
3. line
new wxCharts({ canvasId: 'lineCanvas', type: 'line', categories: simulationData.categories, animation: true, background: '#f5f5f5', series: [{ name: '成交量1', data: simulationData.data, format: function (val, name) { return val.toFixed(2) + '万'; } }, { name: '成交量2', data: [2, 0, 0, 3, null, 4, 0, 0, 2, 0], format: function (val, name) { return val.toFixed(2) + '万'; } }], xAxis: { disableGrid: true }, yAxis: { title: '成交金额 (万元)', format: function (val) { return val.toFixed(2); }, min: 0 }, width: windowWidth, height: 200, dataLabel: false, dataPointShape: true, extra: { lineStyle: 'curve' }});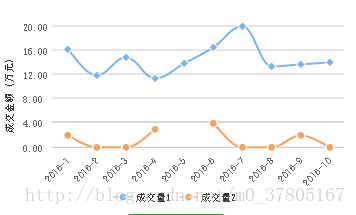
4. column
new wxCharts({ canvasId: 'columnCanvas', type: 'column', animation: true, categories: chartData.main.categories, series: [{ name: '成交量', data: chartData.main.data, format: function (val, name) { return val.toFixed(2) + '万'; } }], yAxis: { format: function (val) { return val + '万'; }, title: 'hello', min: 0 }, xAxis: { disableGrid: false, type: 'calibration' }, extra: { column: { width: 15 } }, width: windowWidth, height: 200,});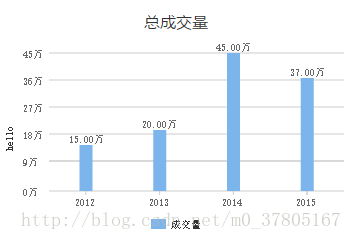
5. area
new wxCharts({ canvasId: 'areaCanvas', type: 'area', categories: ['1', '2', '3', '4', '5', '6'], animation: true, series: [{ name: '成交量1', data: [32, 45, 0, 56, 33, 34], format: function (val) { return val.toFixed(2) + '万'; } }, { name: '成交量2', data: [15, 20, 45, 37, 4, 80], format: function (val) { return val.toFixed(2) + '万'; }, }], yAxis: { title: '成交金额 (万元)', format: function (val) { return val.toFixed(2); }, min: 0, fontColor: '#8085e9', gridColor: '#8085e9', titleFontColor: '#f7a35c' }, xAxis: { fontColor: '#7cb5ec', gridColor: '#7cb5ec' }, extra: { legendTextColor: '#cb2431' }, width: windowWidth, height: 200});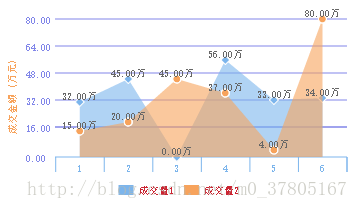
6.radar
new wxCharts({ canvasId: 'radarCanvas', type: 'radar', categories: ['1', '2', '3', '4', '5', '6'], series: [{ name: '成交量1', data: [90, 110, 125, 95, 87, 122] }], width: windowWidth, height: 200, extra: { radar: { max: 150 } }});